Know the Common Lisp power!
Lisp is the most powerful programming language ever
And feel yourself like at the sideral space
Using secret alien technology

Nowadays I make an effort to program on Common Lisp. I use cmucl and sbcl on Linux, but I tried other Lisp implementations. This is a wonderful program to express you, due to It's a very high level language, and It exists lots of libraries and programs that will help you to program everything you can imagine. Moreover, lots of lisp software is free software, like all my software.
I actually develop :
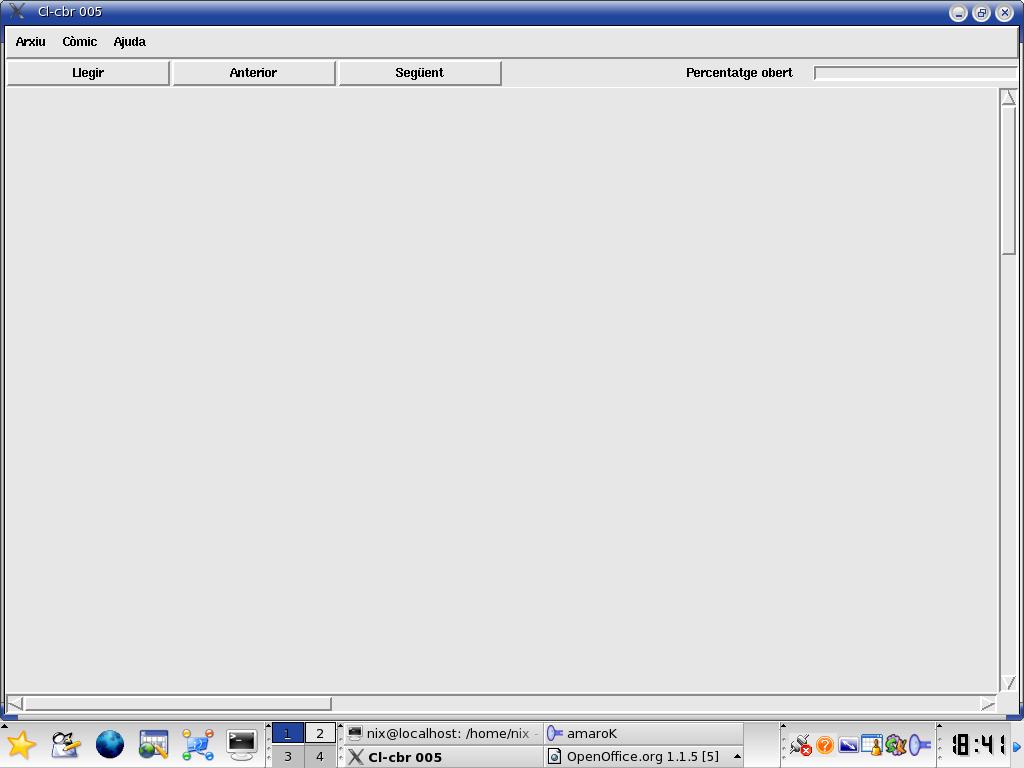
A comic viewer written on Common Lisp, distributed under the GPL license. It's simple and efficient, and It will serve you to read all those files filled with photos that you found at the emule but you never asked how to read. Those are cbr files (comic book archiver), and you can read them with something like cl-cbr.
To install cl-cbr, just load your favourite lisp implementation and use asdf-install:
(asdf-install:install 'cl-cbr)
This will download the sources from internet, and the dependencies too (at the moment, only ltk, a library to use Tk -the Tcl toolkit- from Lisp). To run the program, just write:
(cl-cbr:main)
I distribute binaries for linux and x86. You can find the last release at sourceforge, looking for cl-cbr. To install a binary release, just download and decompress It, and write make at the prompte. To run the program, write cl-cbr at the prompt.
cgn:
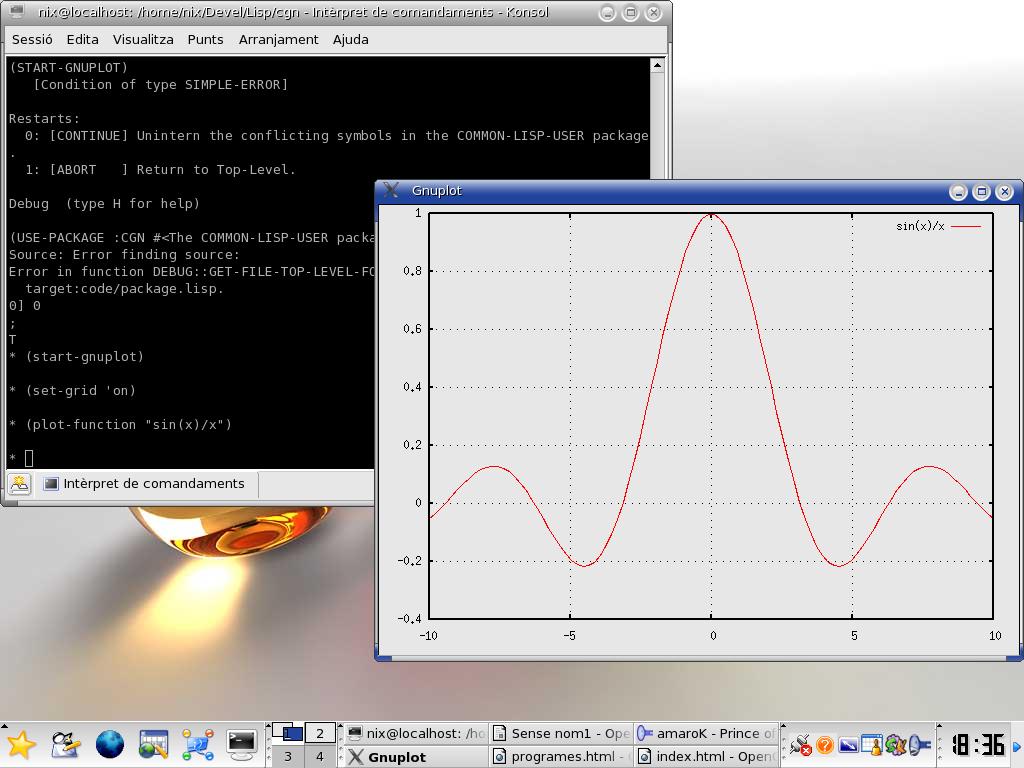
This library was called cl-gnuplot, but I changed Its name because another library is called the same. It's an interface to use gnuplot from Common Lisp. It has been tested successfully on Linux and Windows, but It should work where Ltk and Gnuplot work: Mac OS X, BSDs ... It uses the Ltk library to create a pipe to comunicate with gnuplot. It includes some sugar to do function plots, scatter plots, controlling the grid, titles, ranges ... The 005 release includes the possibility to save postscript copies of your graphics. You can find the last release at Cliki.
The easiest way to install It is with asdf-install:
(asdf-install:install 'cgn)
 This
will solve the dependencies and install the library. cgn can :
This
will solve the dependencies and install the library. cgn can :
;Run gnuplot
(start-gnuplot)

;Close gnuplot
(close-gnuplot)

;Sets the graphic title
(set-title "titol")

;Sets the grid
(set-grid 'on)

;Unsets the grid
(set-grid 'off)

;Shows a scatter plot with x-y error bars.
(plot-points '(1 2 3) '(4 5 6) :x_error '(0.1 0.2 0.3) :y_error '(0.4 0.5 0.6))
;Plots a function of only 1 variable
(plot-function "cos(x)")

;Saves a postscript copy (Linux)
(postscript-copy "sortida.ps" 'linux)
;Saves a postscript copy (Windows)
(postscript-copy "sortida.ps" 'w32)
To do whatever It's not wrapped at the library, you can use the pipe, with the format-gnuplot text function. For example, you can show a 2 variables graphic with:
(format-gnuplot "splot x*y")
PatXi-2:
PatXi-2 is a library to do numerical calculus on Lisp. This is the library I'm developing to help me in my Physics studies, but I'm very interested on numerical computations. I like programming that. Due to this, this library is bigger than I need. I want to create a complete scientific computations library. At the moment, the library provides:
- carlson_test.lisp : tests for Carlson pseudoaleatorial numbers algorithm.
- patxi.lisp : just some utilities for me.
- ph_derivatives.lisp : derivatives. Too much basical.
- ph_estatistical.lisp: some statistics. Too much basical.
- ph_interpolation.lisp: interpolation methods.
- ph_linearAlgebra.lisp: methods for linear algebra on matrices: -solving linear equations systems, lu descompositions, transpose, -inverting ...
- ph_minQuad.lisp: the minimal squares method for functions with linial paramethers.
- ph_montecarlo.lisp : Montecarlo method for integrating. Only 1-variable
- ph_nonLinearEquations.lisp: non linear equations solving. 1-variable.
- ph_pseudoaleatorial.lisp: pseudoaleatorial numbers generators. Only Carlson's at the moment.
- ph_simplex.lisp: a variation of the simplex method for minimizating -functions that works for 1-variable functions too.
- util.lisp: some utilities for me. But It will provide more. I'm adding new methods. To install patxi-2, simply use asdf-install:
	(declaim (optimize (speed 3) (debug 0) (safety 0)))
	(asdf-install:install 'patxi)
You can read the cldoc online documentation. It can be found at the doc/ subdirectory of the tarball.